Eco-friendly Innovation
綠色創新
Study on the Site Response Analysis for Offshore Wind Farms in Taiwan

As a measure to meet the challenges of the energy transition and net zero emissions, Taiwan offshore wind farm block development has now moved to the third phase. CTCI Group, a domestic engineering industry leader, has participated in a number of offshore wind turbine pin piles and transition pieces manufacturing projects (installed capacity reached 1,140MW), continuing to conduct technical research on related field.

This article will discuss the seismic loading effect on the structure design of the offshore wind turbine from the engineering design experience of CTCI REI, a subsidiary of CTCI. Based on Technical Guidelines for Site Investigation and Design of Offshore Wind Farms (2023) published by Bureau of Standards, Metrology and Inspection, the analysis process of the site seismic hazard assessment (including PSHA & SSRA) conducted by CTCI REI will be explained.
Probabilistic Seismic Hazard Assessment (PSHA)
Recording earthquake data from 1900 to the present, the purpose of PSHA is to establish a ground motion prediction equations model for obtaining the uniform hazard response spectra (UHRS) of firm bedrock. The strong-motion record will be matched with the UHRS to obtain design time history of representative earthquakes events (with a high level of hazard) for the use of SSRA (Site Specific Response Analysis). According to CNS15176-1 (2018) issued by the Ministry of Economic Affairs, the requirements for each stage of the PSHA process are as follows:

1.Integrate all the seismic sources and fault data within a radius of 320 km around the target site, then defining geometries of areal sources and selecting source models to confirm characterization of seismic sources.

2.Use empirical ground motion prediction equations (GMPEs) to evaluate the attenuation of seismic energy and calculate the probabilities of ground motion exceedance. In the formula, the epsilon ε represents the ratio of standard deviation to mean predicted value, and the uncertainty range should cover at least ±1.5ε.

3.Use a logic tree approach to develop ground motion hazard curves for different probability levels: 5%, 16%, 50%, mean, 84%, and 95%, representing the associated uncertainties.

4.To ensure wind turbine structures can withstand seismic forces, use a UHRS with a return period of 475 years. The response spectrum should cover at least 20 points from 0.01 seconds to 5 seconds or longer periods. The difference in acceleration values at representative coordinates in the wind farm for a 1-second period and neighboring locations should be less than 0.05g.

5.Select  more influential real earthquakes time history (response spectrum) and fit them artificially with the UHRS to obtain the design earthquake time history (response spectrum) for subsequent site specific response analysis.
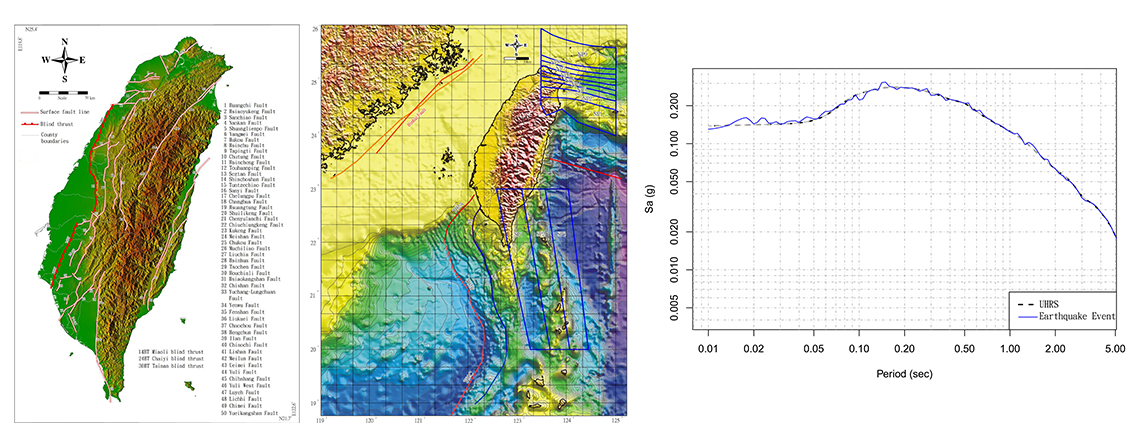
Collecting seismic sources and providing the design time history (response spectrum).
Site Specific Response Analysis (SSRA)
The purpose of SSRA is to assess the effect of the soil layer on design time series (response spectrum) transmitted from firm bedrock to offshore wind turbine location. The site specific time series (response spectrum) will be obtained for dynamic structural design use. According to CNS15176-1 (2018, Ministry of Economic Affairs), SSRA must be conducted at all offshore wind turbine locations.
1.Analysis software
In this study, DEEPSOIL V7.0 software is selected to perform SSRA. The soil data in geotechnical investigation report is used to establish the analysis model, and the depth of reference bedrock is determined by shear wave velocity (Vsd30 ≧ 360 m/s) and serves as the input position for the subsequent design earthquake time history. In the geological analysis model, the soil data including unit weight, shear velocity, dynamic parameters curves for each soil layer need to be inputted.
2.Soil shear wave velocity (Vs)
In offshore drilling investigation, Cone Penetration Testing (CPT) is commonly used to obtain soil data of the offshore wind farm. CPT data is typically converted to soil shear wave velocities (Vs) using empirical formulas. Considering that there are various empirical formulas, it is recommended to compare the results obtained from multiple formulas with data such as PS-logging. After evaluation, an appropriate formula can be selected.
3.Soil dynamic parameter curves
The soil dynamic parameter curves mainly consist of modulus reduction curve and damping ratio curve. They represent the soil's dynamic parameters at various shear strains and are typically derived from tests such as resonant column and dynamic triaxial tests. Regression analysis is performed to obtain the dynamic parameter curves. If there are limited or no dynamic test results available, it can result in significant uncertainty in the design analysis. Therefore, this study compiled relevant data from domestic and international sources and provides recommendations for selecting dynamic parameters for different soil layers.

(1)Sand soil layers
The study published by Seed and Idriss in 1970 conducted extensive literature review and tests to provide representative dynamic parameter curves and their ranges.The Harbor and Marine Technology Center of the Ministry of Transportation in Taiwan conducted a research (1986) for silty sand in west coast area. Based on the experience of CTCI REI, the latter is considered to be more consistent with actual test data and is recommended as a reference.

(2)Clay soil layers
The research published by Vucetic and Dobry in 1991 collected a large amount of literature and test data to develop representative dynamic parameter curves. They also proposed that the dynamic parameters of clay soils vary with the plasticity index (PI). Considering the significant variability of clay soils, this study should be given higher reference value.

(3)Gravel soil layers
The research published by Rollins et al. in 1998 collected a significant amount of literature and test data to obtain representative dynamic parameter curves and their ranges. We compared the geological data, such as gravel content and maximum particle size, with the data compiled in this research to confirm the inclusion of similar gravel layer data. This provides some reference value of the compiled data.
4.Site response analysis results and developments
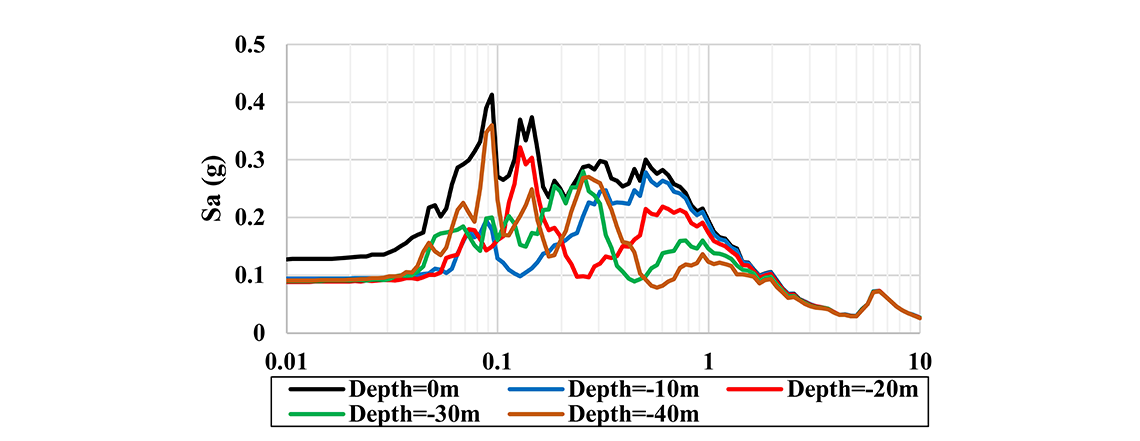
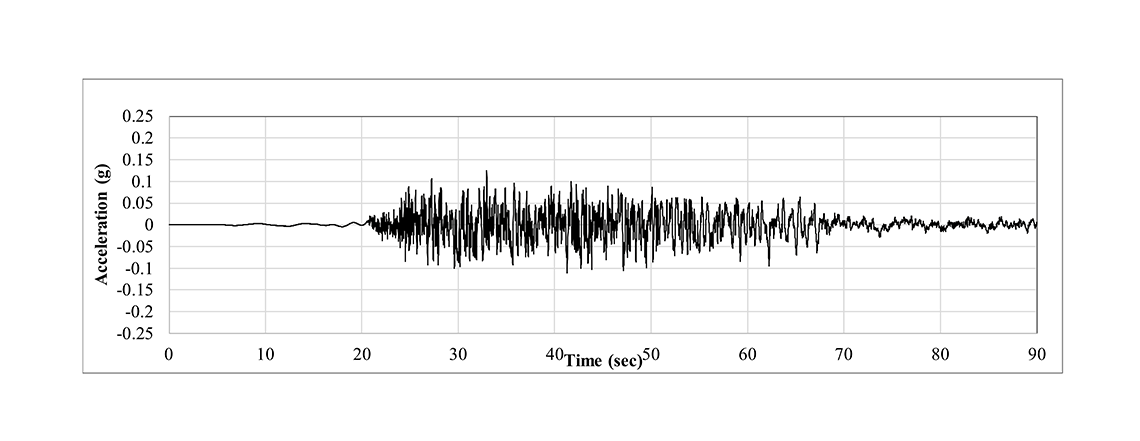
After setting the parameters for each layer in the analysis model, the site response analysis is performed by inputting the design earthquake time history at the position of the reference bedrock. The earthquake time history should include at least seven sets, each consisting of three direction components (N/S, E/W, V), at least two return periods (475 years, 95 years), and different output depths (based on the requirements of structural dynamic analysis).
Therefore, for a single offshore wind farm, thousands to tens of thousands of SSRA results are typically generated, requiring a significant amount of manpower for compilation.
Conclusion
CTCI is dedicated to facilitating sustainable development goals and has been delivering green engineering projects around the world. The offshore wind power being an important element of green engineering, CTCI REI cooperates with Taiwan Tech (National Taiwan University of Science and Technology) for developing the automated program of SSRA analysis process through a technical research plan of CTCI Foundation in 2023 to enhance CTCI’s competitiveness in offshore wind power. Not only will it reduce the manpower requirement and improve efficiency, but it will also advance the future development of automated program development for offshore wind power engineering works. With the assistance of smart technologies, digital transformation in the engineering industry is already underway.
SSRA results - site specific time series
SSRA results - site specific response spectrum