Sustainable Future
永續未來
Energy-Saving Applications of Mr. Energy in High-tech Plants
— David Tsai, Product Manager of Industry Data Application Department, CTCI Advanced Systems Inc., Group Intelligent Solutions Business
Energy is vital for economic development and has big impact on the quality of people's lives. The constraints that Taiwan faces both geographically and environmentally means that 98% of its energy consumption rely on import. In particular, enterprises are heavy power users. An efficient energy management therefore not only impacts business operations but also global sustainability. Mr. Energy, an intelligent energy management system developed by CTCI Advanced Systems Inc. (CTCI ASI), a subsidiary of CTCI’s Group Intelligent Solutions Business, is a line of products developed for energy-saving and emission-reduction purposes. This energy information management system platform not only allows business operators to better manage their companies’ energy consumption by monitoring, analyzing, estimating and adjusting energy use in alignment with the Plan-Do-Check-Act (PDCA) cycle, but also helps achieve informationization of energy management by making effective predictions on energy consumption and strengthening energy management.
Energy Management in High-tech Plants
Taiwan's high-tech industries have seen rapid development over the past 30 years, among which the semiconductor industry contributes to 26% of Taiwan's total GDP—an important driving force for economic growth indeed. Despite the substantial output value, employment opportunities, and leading R&D expenditures brought along by the high-tech industries, there has also been a clear hidden concern on the large amount of energy consumed.

In high-tech industries, all major equipment are always running 24/7. This includes process equipment (take wafer production as an example, it involves film, etching, yellow light, and diffusion processes) and other utility equipment used in production plants, such as air conditioners, pure water, wastewater, cooling water and air compressors. Every component in a plant operation inevitably consumes energy. It is therefore in any company’s best interest to be capable of managing the entire plant’s energy consumption by monitoring the performance of every equipment, such as through power meters, combined with the adoption of Mr. Energy for power consumption analysis and management.

Factories are generally comprised of office areas, utility areas, and process areas. The cost of traditional power meters installation, cable engineering, and related risks in the office and utility areas of high-tech factories are similar to that of other industries; however, in the process area (i.e., the clean room), where process tools are located, the cost is much higher because construction staff need to wear clean room suit, and construction tools must comply with clean room requirements. As a result, much time and effort are spent during preparation and during construction.

Production accounts for half of the energy consumption in high-tech plants. Despite this important fact, monitoring energy consumption of process tools remains a challenge due to the fact that there are a lot of accessory equipment, and some process tools may even span across multiple floors. Even though we have seen the cost of smart power meters hardware dropping thanks to the rapid progress of technology, we have not seen any sign of decrease in labor cost incurred from construction in the clean room. This is why it is imperative to improve the efficiency of power meters installation. Fortunately, thanks to the joint effort between meter manufacturers and a well-known semiconductor wafer manufacturer, we now have wireless IoT power meters. The way this type of meter works is by replacing traditional power meter wiring to process tools with a wireless CT signal module buckled to the distribution board of process tools. The electric current of the process tool is then transmitted to the collector wirelessly, significantly reducing hardware installation costs and improving manual installation efficiency. The collector then transmits the electric current data to Mr. Energy through Ethernet for data pre-operation, allowing Mr. Energy to perform power consumption management and analysis. Once the process tools are tracked for a long period of time, key opportunities for improving energy-saving performance may then be identified. An evidence of Mr. Energy’s contribution to helping clients better manage their power consumption can be seen in a technical paper (see note) presented by Taiwan Semiconductor Manufacturing Company (TSMC) during Hsinchu Science Park Facility Technology Conference in November 2019, in which the author discusses the way TSMC is able to visualize power consumption management by collecting power consumption data with wireless IoT power meters buckled on the distribution boards of process tools. This demonstrates the combined power between Mr. Energy and meters in helping customers better manage power consumption with data, which indeed marks a new step forward.
How Can Mr. Energy Help Clients Manage Energy?
The way Mr. Energy effectively helps customers carry out plant-wide energy management can be briefly explained as follows: It extracts data from the plant system, analyzes power consumption data that comes from process tools, then incorporates all plant data, process tools, power consumption data, and production capacity data into one single system, and finally conducts big data computing, analysis, and comparison, so as to bring about an energy management system that suits each client’s particular needs.

Mr. Energy’s system services and functions fully comply with ISO 50001, an international energy management standard. Through our user-friendly interface, energy performance evaluation has never been easier than before. Users do so by following standardized data principles before implementing PDCA management cycle. The PDCA cycle helps business managers keep improving their energy management measures, which in turn helps reduce management cost. By integrating real-time energy data collected from front-end equipment meters, users can then compare the actual data with baseline data, which helps identify problematic issues and verify the benefits of energy management systems. A detailed description of Mr. Energy’s main functions and a power consumption case study on its application in high-tech plants are as follows.
I. Main Functions
● Setting Energy Performance Indicator (EnPI) and Energy Baseline (EnB): Users are allowed to input energy consumption variables related to EnB at will. They are also allowed to apply those energy consumption variables to EnPI formulas to verify energy performance. Verification of energy consumption performance is carried out in accordance with International Performance Measurement and Verification Protocol (IPMVP).
● Mr. Energy SED (Smart Energy Device): Performs data standardization and other logical operations for raw data.
● Mr. Energy SEM(Smart Energy Management): Performs intelligent analysis on the processed variables for allocation and energy consumption modeling.
● Mr. Energy SEC (Smart Energy Center): Allows users to make their own energy management web pages with ease through various built-in controls.
● The entire system is an online operating interface. As long as there is internet connection, users can always check their energy consumption status.
● It is equipped with data exchange interface to connect to the users’ IT system for data integration, analysis, and application.

A major purpose of setting the Energy Baseline (EnB) is to solve problems that cannot be easily dealt with through traditional energy management methods—e.g. comparing two things that are not on equal grounds. A typical example is that the chillers' power consumption in winter and in summer cannot be directly compared with each other, owing to different operating conditions under these two drastically different weather conditions. Another problem is the difficulty to verify a system’s energy-saving performance. To illustrate this problem, consider some energy saving measures have been performed on a device, and energy consumption falls from 1,000 kWh to 990 kWh per day. How could the users tell if the reduced 10 kWh is a direct result from such energy-saving solution rather than from other possibilities, such as different operating conditions, reduced production capacity, or improved efficiency after equipment maintenance?

The solution is the EnB model, which separates baseline period from reporting period. Baseline period denotes a selected time interval or uptime (e.g. one year) before the intervention of improvement measures, during which things are allowed to go as normal. All variables that may possibly impact energy consumption, including production capacity, enthalpy of outdoor temperature and humidity, static variables (e.g. number of machines, number of people), and unit yield are being taken into account when performing multivariate regression analysis and multiple cross-calculations, before a final set of regression formulas that best describes the current situation can be selected. This set of formulas also stands for future energy consumption performance forecast based on the various circumstances the system is currently facing. All the user has to do is simply key in relevant variables and their values, and the system will produce a power consumption forecast for the identical circumstances, as shown in Figure 1.
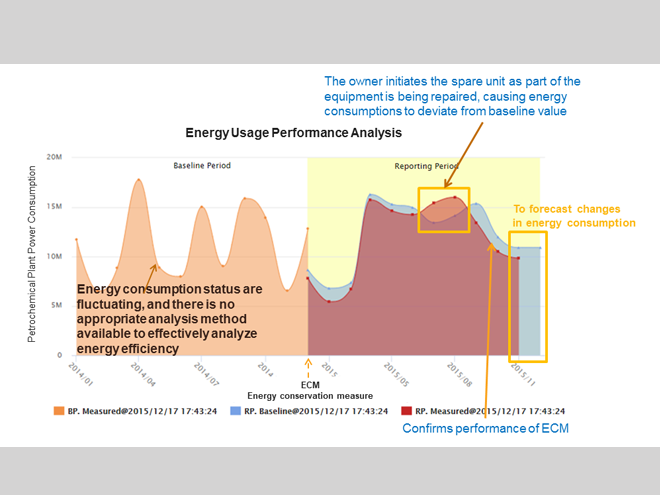
Figure 1. Establishing Energy Baseline for comparison with the reporting period.
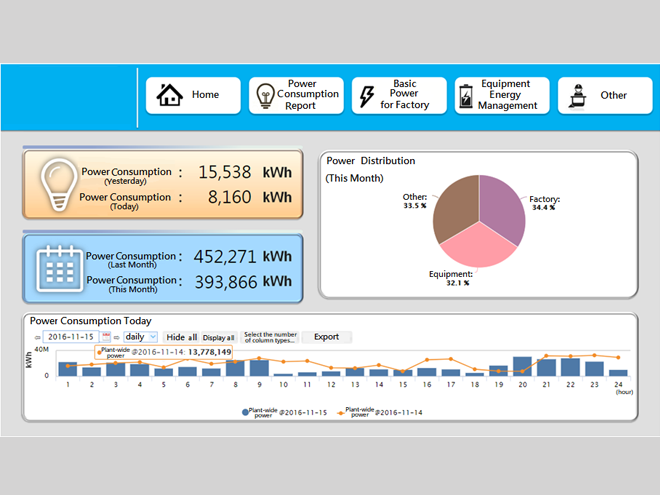
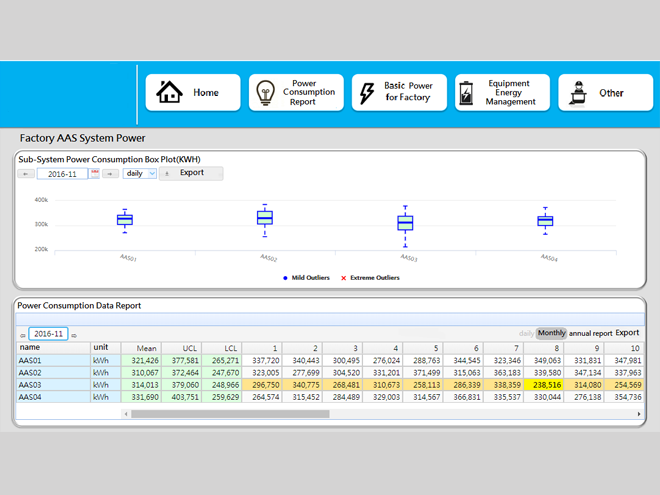
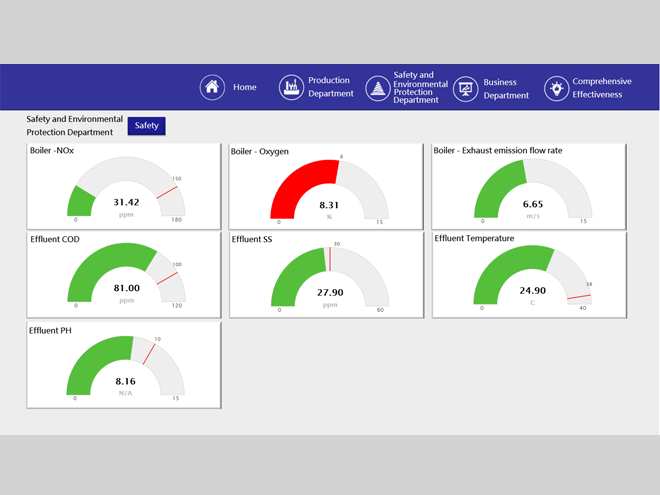
Figure 2 illustrates a page layout of Mr. Energy’s energy management interface. Nice user interface and multiple graphical components (controls) are in place for users to edit screen layouts, and editing does not require any coding skills. Simply use the controls on screen to make a beautiful layout with ease. On the same screen there are also visualized charts and graphs so that the user can swiftly make effective decisions.
II. An Analysis of Process Tool Energy Consumption in a High-Tech Plant
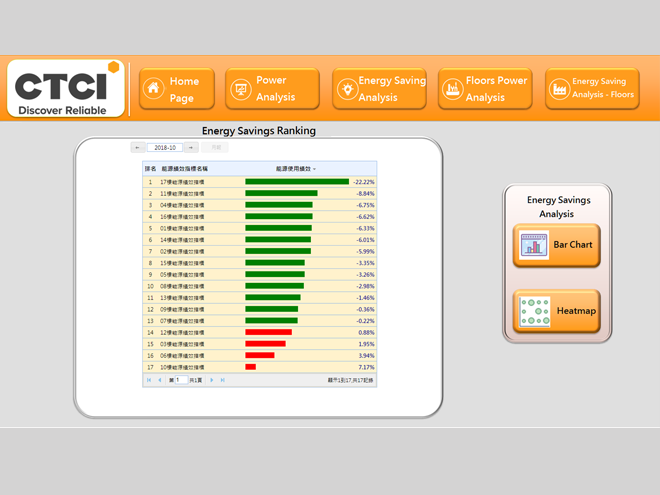
Mr. Energy utilizes K-Means Clustering big data analysis module to perform an accurate assessment and a visualized report on every process tool’s energy consumption in idle state. By comparing the difference of energy consumption between the same process tools that are in idle state, Mr. Energy is capable of locating the process tool that consumes the least amount of power, and can furthermore calculate potential amount of energy to be saved. This in turn serves as valuable reference for equipment manager when it comes to energy-saving decisions (as shown in Figure 3).
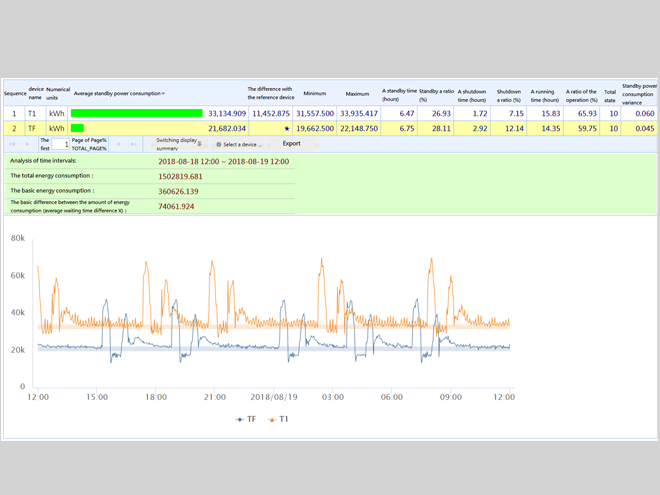
Figure 3. A diagram illustrating energy consumption while an equipment is in idle state.
Conclusion
An accurate energy management relies on frequent reviews and monitoring. When energy consumption has changed significantly or the energy baseline has deviated, revisions are necessary. Given that monitoring energy performance is a highly complicated and time-consuming business, a comprehensive, semi-automatic information management system can eliminate manual input errors and improve management efficiency.

Mr. Energy, a system developed by CTCI ASI, enables clients to effectively monitor, predict and manage energy use through big data analysis, with the aid of meters mounted on individual process tools. By establishing an energy baseline, this system can not only help reveal actual energy consumption according to various variables, but can also provide real-time data from all energy consumption indicators of each system and each individual process tool, thereby helping to detect problems early on and make corresponding improvements. Moreover, in line with ISO 50001, Mr. Energy allows users to compare energy consumption performance across similar equipment, something that can serve as reference for process tool manufacturers to improve energy efficiency in the future. This is a win-win situation for both businesses and global sustainability.


Note: “Application of Wireless IoT Power Meters in Constructing an Energy Management System.” This research paper can be accessed under the category of “Power”. Presented during Hsinchu Science Park Facility Technology Conference, 2019. To download the paper (in Chinese), go to: http://www.asip.org.tw/userfiles/file/2019/Hsinchu/P2.pdf